Hit Enter to search or Escape to close
This article is based on the work and observations of Dan Luu, Senior Data Engineer at Arrayo. With 8 years of experience in the Life Sciences industry, Dan has experience with wet lab, dry lab, and data automation initiatives.
Most scientists will agree that they spend too much time on tedious manual tasks when summarizing data. After a standard assay is established, manual data processing is still common. That said, it is not always easy to tell when automation is truly needed.
Are you still using Excel or a master file to analyze and store assay data? While still relevant today, this kind of method is an old approach in our industry when it comes to storing cumulative data. Currently, there is a new trend of employing automation tools and practices that streamline the end cycle of assay development. What are some signs you should follow this trend?
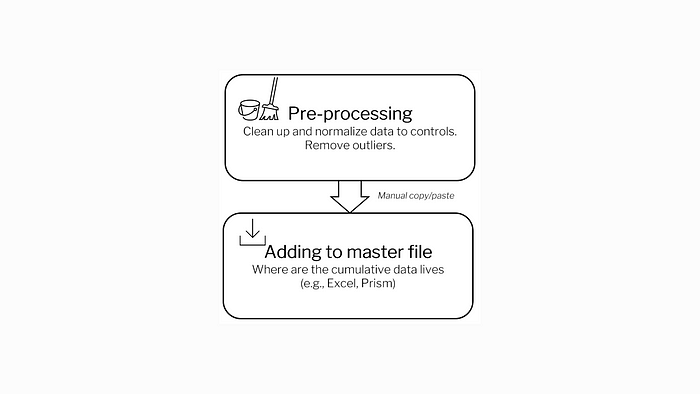
Sign 1: You still process data via flat files
First, saving all your individual experiment results in a single excel file often leads to frustration when moving data and creating summaries. Second, relying on one master file shared throughout the company can lead to devastating mistakes in documentation control. For example, a new hire could accidentally change a data record that leads to major downstream effects in terms of analysis. Likewise, there could be a copy/paste mistake from an experiment file to the master file. (We’ve all done this.)
Both are considered flat files because there is no relationship between experiment data and summary data. The alternative to flat files is a database which has proper relationship management and documentation control. There is not so much copy/pasting when everyone uses a central database. Experiment data is always added to the master table instead of being stored as an individual flat file. Since all data is consolidated into one location, any failed assays can be marked and labeled as so.
Even though Excel has version control capabilities, it may still fall short when managing valuable company data. Not everyone will always look at recent changes for potential mistakes before adding data, whereas with a database this cannot happen without proper authentication. Databases are an essential element of automated data practices since data management is crucial to standard assay testing.
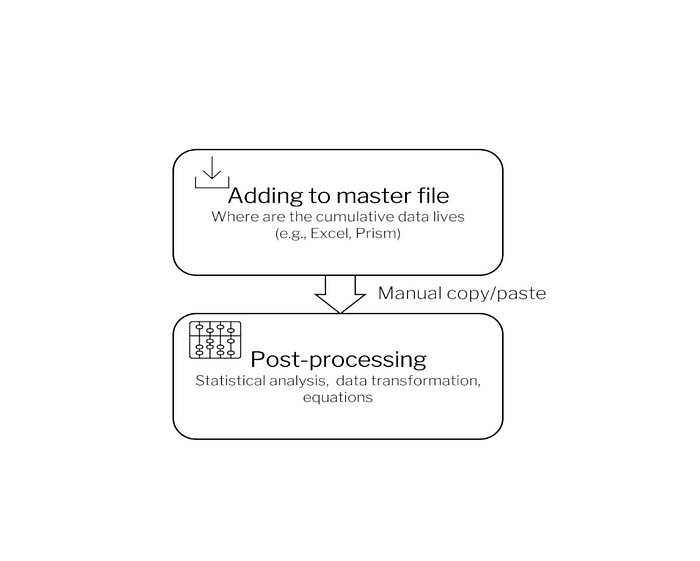
Sign 2: Your current aggregate analysis is confined to Excel and Prism
Excel or GraphPad Prism are powerful analytical tools, there is no denying it. For assay development, these tools have everything you need. Excel or Prism’s macros are also useful when you are running simple ANOVAs and t-tests.
However, when you run more complicated analyses, you may start pushing the limits of these tools’ capabilities. Even if you set up macros to do the analyses, you are still restricted to copying and pasting from the first result file to the analysis file.
Excel or GraphPad Prism are meant to be analysis tools but are often used as data stores, which is not always their strong suit. There are better ways, namely programming automated solutions or using pipeline development software.
For standard assays, programing may allow you to analyze incoming data faster than if you were to physically move it around Excel or Prism, depending on how rigorous your analyses are. For example, programmatically writing custom analyses (e.g., transcriptomic, pharmacokinetics, or biophysical analyses) may be faster than relying solely on Excel.
If you only have a few standard assays and are still relying on these master files, that might be still okay. But when you have multiple standard assays developed and you are using them to do high throughput screening, it is much more efficient to streamline these tasks via an automated solution.
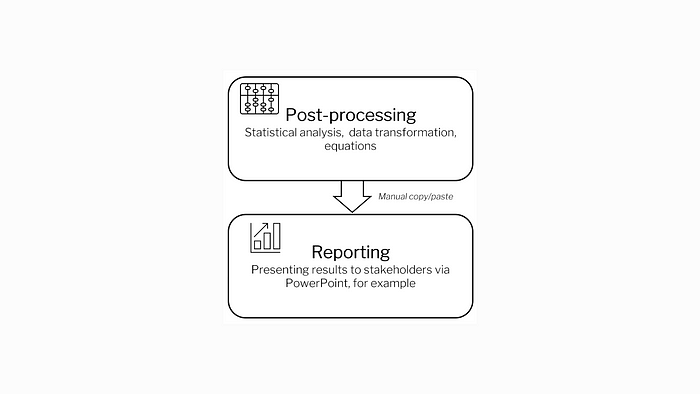
Sign 3: You generate repetitive graphs in PowerPoint
After you have analyzed your data to generate a graph, you are still left with the task of copying and pasting that result graph into a PowerPoint presentation for your weekly update meeting. Conversely you could summarize weeks’ worth of data for a bigger meeting, but still need to run a summary analysis and find all your previous results again. You are already generating too many reports and/or PowerPoints for one assay.
In addition to the tedious manual effort involved, stocking experiment graphs in PowerPoint is a sure way to lose sight of those analyses in the long term. Once it is presented to stakeholders, the PowerPoint is often stored in some folder, lost, and rarely consulted ever again. This is inefficient because as a result, certain experiments may be repeated needlessly when you are working in different teams without central oversight.
Automation might look like a dashboard report that generates automatically based on your assays. Saved in a centralized location, a dynamically generated dashboard is a great tool to keep track of current results and performances of assays. If done properly, these reports would allow you to see how data has been changing from one experiment summary to the next over time. Finally, it would save you time spent remaking those graphs for weekly meetings.

Conclusion
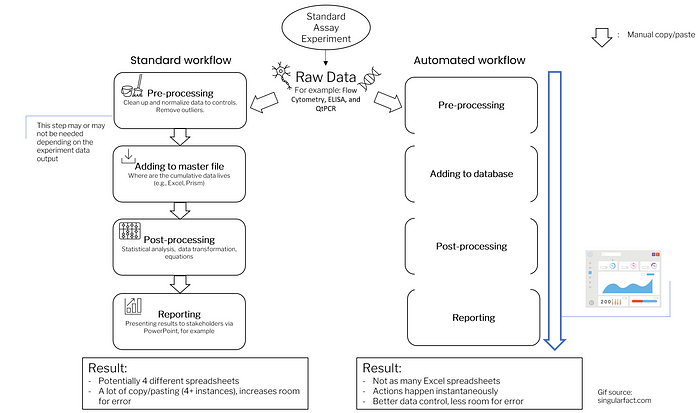
All three signs highlight the manual effort involved in manipulating data and transforming data to the next desired format. Automating your standard assays in an ETL (Extract, Transform, and Load) format will allow you to spend more time going over the actual results of your data.
In a fully automated workflow (i.e., where none of the three signs apply), you would only need to copy and paste once: the result of your experiment to your online notebook*. The data would then be uploaded to the database, enter a processing pipeline where it is analyzed, and automatically update a live dashboard which can be accessed by all stakeholders.
An additional benefit of automation is that when another assay is about to become standardized, it is often easy to port over the automation tools. This in turn gives you more control over all your company’s project data.
How many of these signs do you see in your everyday workflow? If you see two or more signs, then you may want to consider automation. Automation is not all or nothing. Often, it can be as simple as setting up a database or some macro tools that will make your life easier; however, if your assays and data are growing complicated, a broader automation solution may be necessary. One option is to utilize and modify vendor-made solutions and the other is to build your own automation pipeline in-house using best practices. The initial investment in automating your workflows is often high in development time and cost. But it is only necessary to do once, and the subsequent assay runs will be automated provided there is routine maintenance.
*Footnote — On the topic of physical notebooks:
How do you manage physical notebooks in an automated workflow? Many scientists and research associates still use a physical notebook, but online notebooks are gaining popularity because they are interoperable with automation tools. We’ll go into more detail in Dan’s next article.
Written by Olympe Scherer and Dan Luu for Arrayo.