Hit Enter to search or Escape to close
How can this new technology concretely help with data quality monitoring?
Context: Data Quality Bottlenecks
Data applications have an increasing amount of data to aggregate and process. Thus, data quality issues hamper business and activity monitoring.
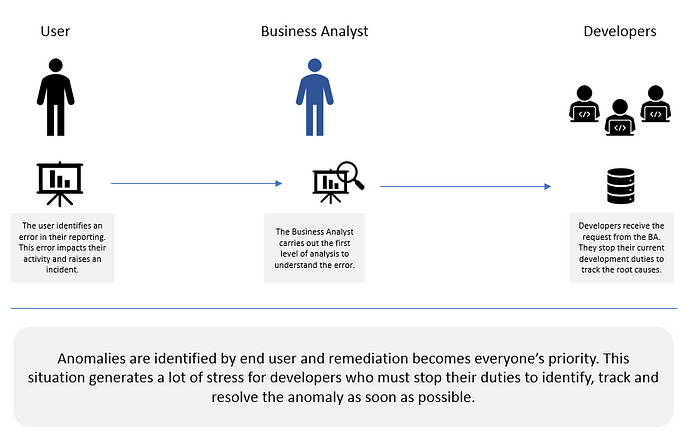
Data quality problems and anomalies are often identified by end users, who then submit an incident ticket to the Data team so they can fix it. Data quality tasks represent significant manual effort. When Business and Data Analysts work on data issues, they spend the bulk of their time trying to identify and understand the issue, and not nearly as much time on remediating it. Due to frequent data quality tickets from the business, project teams must stop their development activity (e.g., development, etc.) to correct these anomalies.
Time wasted on data quality tasks…
- Jeopardizes the trust between the business and the data office.
- Hinders data analysts’ ability to work on developing new reports, i.e., innovate.
- Poses a human resources risk: frustrated data analysts may lose motivation. Poor data quality also generates stress across the business and IT.
Before we move on to machine learning, let’s better define what we mean by data quality. Let us also explain how a commonly used technique, data profiling, can be useful for monitoring data quality issues.
Data quality encompasses data consistency and data accuracy.
We define data profiling as a manner of assessing data in terms of structure and content.
For example, let’s imagine a column storing birth dates, in which all data must fit the following format: mm/dd/yyyy. Say that Max is born on January 1st, 1982. If the cell indicating his birthdate contains “01/01/1982,” the data is formatted correctly, i.e., it is consistent. If the cell contains “011/01/1982,” “Jan 1st, 1982,” or nothing at all, that will raise an error and prompt escalation. Thus data profiling represents a quick way to check for data consistency. But what of data accuracy? Does the data reflect reality? Indeed, what if the cell corresponding to Max’s birthdate contains “01/01/1967”? While the cell’s content conforms to the expected formatting, the data itself is wrong, i.e., inaccurate. Thus, data profiling can overlook data accuracy issues.
In sum, while data profiling can be effective for checking data consistency and identifying potential issues in a dataset, it may not be enough to ensure data accuracy. This is where machine learning can be useful.
How Can Data Offices, as Part of Their Modernization Goals, Leverage Machine Learning to Identify Potential Data Issues?
Machine learning helps proactively identify data quality issues before they impact downstream systems and the end user.
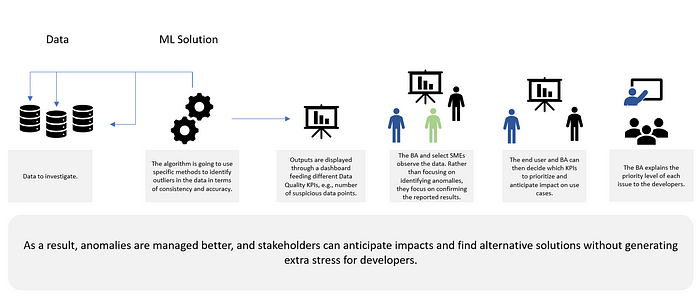
First, a given data set is picked to be investigated. Second, the machine learning algorithm identifies outliers in the data (further explanation can be found under the Machine Learning Techniques section of this article). Third, these outliers are displayed via a dashboard in terms of data quality KPIs, such as “Number of suspicious data points.”
Based on the dashboard, the Data Analyst, end user, and one or more SMEs confirm the detected anomalies as data issues. Then the Data Analyst and SME decide which data issues to prioritize based on their impact on reports. Finally, the Data Analyst tells the developers about the data issues and which issues need to be remediated in priority.
Thus, the successive interactions are less stressful than those in the current state described earlier.
Next, we’ll focus on the technical approach of machine learning.
Machine Learning Techniques
In machine learning, it is important to understand the difference between detection of outliers and detection of anomalies. Outliers correspond to data points that are significantly different from the rest of the data. Anomaly detection focuses on suspect behavior and patterns. Even if these notions are strongly related, an outlier might not be an anomaly and an anomaly might not be an outlier.
Whether we want to identify potential issues at a column level or at an element level (in the row) from a dataset or table, the key is to understand both the data’s behavior and the business perspective. Then, you can analyze and clean data to build your machine learning model.
Different machine learning approaches make it possible to identify different patterns and outliers. Since there is often no documentation of anomalies and no data labels (to use a supervised algorithm), unsupervised algorithms can be a good starting point. Examples of unsupervised algorithms:
- K-means clustering: simple and elegant approach to partition a set of data into distinct and non-overlapping K clusters. To perform K-means clustering, you must first specify the desired number of K clusters; then, the K-means algorithm will assign each observation to exactly one of the K clusters. Depending on the input, K-means will classify the data into clusters and data located far from the cluster will be considered an outlier and potentially signal a data problem. The advantage of K-means clustering is that K-means algorithms are very simple and give relevant results.
- Isolation Forest algorithms: these detect anomalies using the isolation technique (data remote from the rest of the set). This technique is also very effective to detect outliers.
- Local Outliers algorithms: these calculate the local density deviation of a given data point with respect to its neighbors.
- HBSCAN: is also a clustering algorithm that can determine automatically the number of cluster based on the density of the data. This powerful algorithm is also useful to data having high probability to be in error.
- Other interesting algorithms, such as SVM, KNN, or DeBaCI. The most important thing is to try different algorithms to observe and compare results. If the same outlier is identified by another algorithm, we are more confident about where to focus our analysis. In sum, you must benchmark different algorithms based on results, performance, and scalability.
Once you have clustered data and identified outliers, it is important to go further and to be able to explain why we have these outliers. For this, we must analyze and explain the identified patterns, and share it with the business and SMEs.
We have to keep in mind that results are strongly conditioned by the state of dataset, therefore is important to analyze the data according to:
- The profiling: datatype, duplicates, seasonality of data — time series, unique values, the distribution, missing values, etc.
- The relationship between columns: correlation, chi test, association mining rules, etc.
- Columns/features reduction : the dataset may contain many columns , sometime it could be useful to reduce the dimensionality of data (ex : Principal Component Analysis algorithm)
These tasks are essential to prepare the dataset and can give us an idea of potential impacts on the results.
The Involvement of Subject Matter Experts and the Feedback-Driven Approach:
A Subject Matter Expert (SME), an expert in the domain at hand (e.g., Finance, Risk, Compliance, Translational), is needed to give feedback on the results provided by the model. The idea is that the SME must confirm the anomaly and provide an explanation for it. This information allows the analyst to adjust the model (via segmentation, profiling) and improve the approach.
Implementation of the Machine Learning Solution
Once the model is ready, it can start interacting with the target system.
Here are several considerations:
- Where the model will be implemented: in the system in question or outside (e.g., on the cloud)?
- Architecture and scalability
- Interaction between the system and the machine learning solution: API, or other?
- Impact on performance: if an SLA (Service-Level Agreement) is expected, we have to make sure that the machine learning solution will not generate a delay in providing data to end users
- Maintenance and monitoring: create a versioning plan for the machine learning algorithm and monitor the performance
- Resilience: it’s necessary to build a resilient architecture so that if the machine learing model is unavailable, the system can still work.
Looking Forward
Enterprise machine learning solutions are very useful tools to improve anomaly tracking and reduce manual analysis effort. A strong commitment from stakeholders under the command of a data office will allow us to make a successful transition from unsupervised learning to supervised learning. This is possible with a real Data Issue Management policy that must include:
- Saving logs to create a knowledge base
- Organizing errors by criteria
- Reproducing the errors in database
- Labeling data
- Training an algorithm
- Regularly testing and evaluating the performance of the algorithm
Building a knowledge base of anomalies will make it possible to build and train a model to better target anomalies (i.e., supervised learning).
In sum, AI through machine learning provides an effective solution to help large organizations overcome challenges related to data quality. An effective machine learning strategy requires a real commitment from all involved stakeholders.
Written by Nicolas Drisse Vaillant, Senior Data & Analytics Lead at Arrayo, and Olympe Scherer.