Hit Enter to search or Escape to close
With model training occurring across different environments and being done by different people, it can be hard to keep track of what model types and parameters have been done by your organization. Further, post-hoc evaluation of models can be very challenging because images for items like training curves and different scoring metrics may not be saved in a way that is easy to recall after the fact. Both of these problems, as well as model hosting and model training curves can be solved simply with an open source tool called MLFlow by Databricks.
MLFlow is an open source tool that ML and Data Science professionals need to know about as it can make many parts of their lives significantly easier with just a few lines of code. People who manage these professionals also can get a lot of value from the tool because they can easily get access to information about how the models are performing and can present these results without having to take their team away from their work.
IMPLEMENTATION
To get an enterprise ready installation of MLFlow up and running, most of the work is in setting up a server with setting up a server with security as deemed appropriate by the organization. MLFlow can work with pretty much every security paradigm by putting the API on a server either inside of a VPN, with SSO, with SSL, or whatever kind of authentication fits the need.
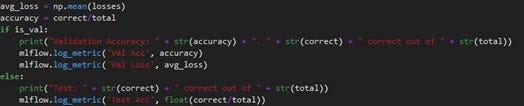
Where MLFlow really shines is in making the lives of ML and data professionals easier to the point that a couple of groups we’ve worked with have attested that they can’t go back to what they did before. Integrating MLFlow into tracking is as a line of code per metric to be tracked. As shown in the figure below, any number that you want to have tracked at test time, every epoch, or even every batch can be sent to MLFlow very easily.
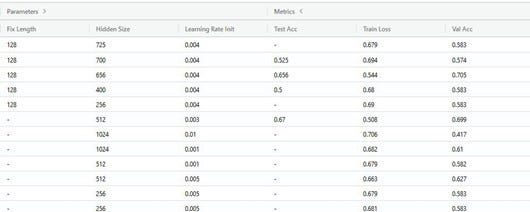
Since MLFlow organizes all metrics, output, and even the models made at training time the users don’t have to worry about which machine they trained the model on or where in the folder structure they saved it. With correct configuration this file store can be almost any file system that the client has access to so highly fault tolerant and inexpensive memory can be used for artifacts.
USER INTERFACE
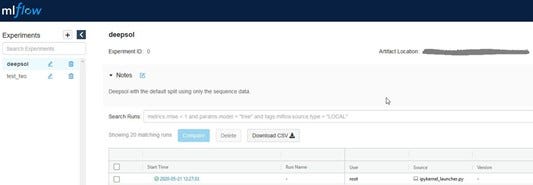
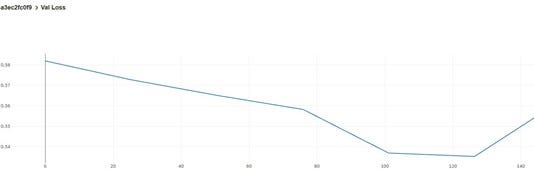
MLFlow has a GUI to interact with all runs, including runs that are currently ongoing. In this interface, users can track how the models metrics performed over time and these training curves are built automatically. This allows for MLFlow to stand in for items like a framework and library agnostic version of tensorboard for any model that is trained by repeated sampling of data. For example, from the code above a validation loss chart would be created for the user which may look as below.
MLFlow’s UI allows for the removal of any runs that are not needed for whatever reason. This removal is done as a soft delete in case this is done in error so no data is actually deleted. Mostly, this functionality is useful to remove runs that weren’t completed or errored out and not restarted for whatever reason.
CONCLUSION
MLFlow helps organize and track model work done across teams of ML and data professionals. For the individual scientist, all of their work is tracked and stored in a centralized location that provides great visualizations right out of the box. For the team lead, all of the work being done is in the same place so they can easily keep track of progress and current performance without having to interrupt teammates for key metrics. Using a tool like MLFlow can be fun and encourage collaboration because of the open nature of performance so teammates can team up to try to beat the current best benchmark and see what is and what isn’t working on all of the important datasets for the team.
*This article was written for SteepConsult Inc. dba Arrayo by John Hosmer.